
This post was originally published December 4, 2022.
It’s time to assess my midterm predictions. Here’s what my final spreadsheet looked like:
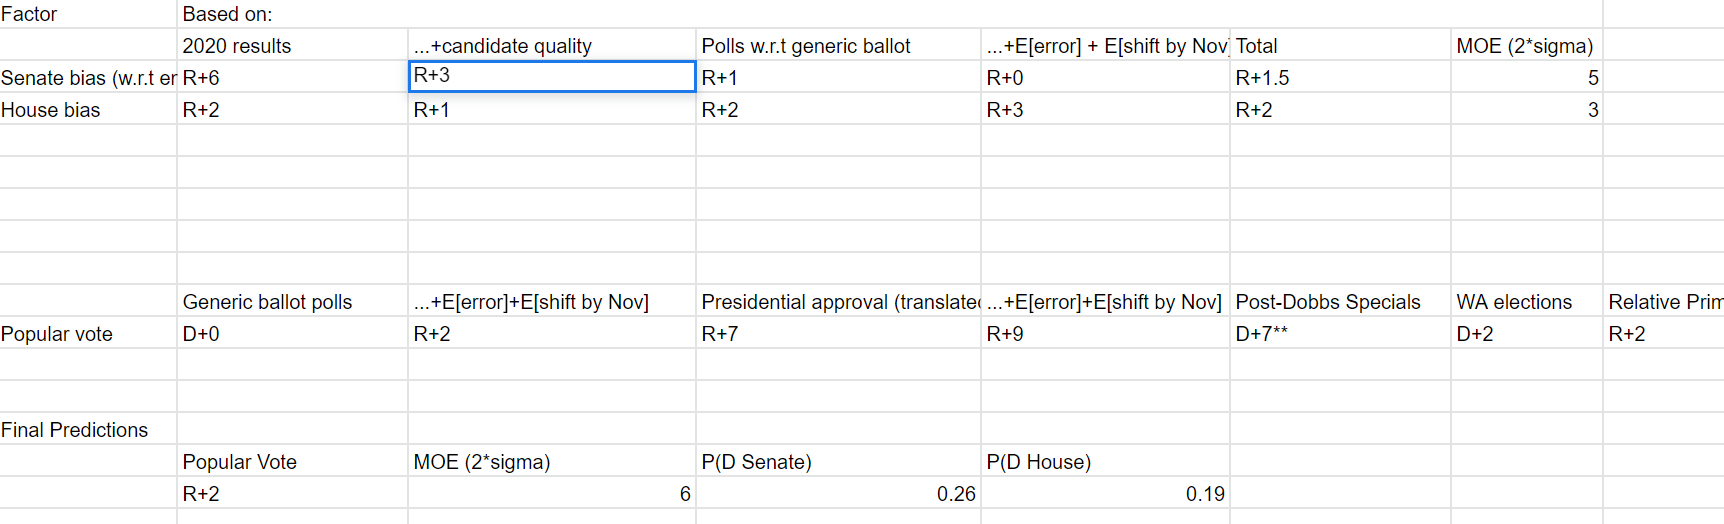
You can see this Twitter thread if you want to hear more of my thoughts and some state-by-state stuff.
I did ok. We got something like the 22nd percentile of my model, just going by the topline results. I’m going to take the final popular vote adjusted for uncontested seats to be R+1.5%. Using this number, I nailed the popular vote, while the Senate and House biases (D+2.15 and D+0.5 respectively) were just barely in my MOE.
To more fully assess my predictions, though, it’s worth going through the results in detail.
I would say there were three main outcomes from this election:
1) polls nailed it
2) candidate quality mattered a lot
3) the popular vote was weird, very different political environments state-by-state
First, on (1). I was a vocal proponent of the "polls will underestimate Democrats again" theory. I actually ended up being right about this on the federal level, but in general polls were amazing race-by-race.
I still think I was justified in this theory. Polls overestimated Democrats in the midwest 3 cycles in a row beforehand, and pollsters hadn't adjusted ~at all. Polls were again showing really optimistic numbers in WI/OH/PA until (and to a lesser extent during) the last month.
I think the way I put this in the model - taking 2020 and scaling it back a bit - was the right approach as well. I do wish that I had done this for OH/WI though. For the other ones I just took off 1 point off the 2020 error, but I would have adjusted more for OH and WI, though I’m not sure by how much. This wouldn't really matter much for the final forecast - I would have given them ~0 chance to be the tipping point states, and they weren't - but it still makes my prediction look better than it actually was.
Expected bias counted for ~half of both my Senate and House polling error. The other half had to do with (2) and (3) - the general weirdness that was this election.
Starting with (2), it’s pretty clear that candidate quality mattered a lot this election. Republican turnout was actually up over Democratic turnout relative to 2020, and yet Democrats won in swing states where Biden had barely squeaked out a victory. Incumbent democrats in swing House districts significantly outperformed others. You can also do within-state comparisons between different candidates that show that there was a lot of variation attributable the candidates in the race.
I underestimated the significance of candidate quality. But what I think I really did wrong was not treating “the significance of candidate quality” as a single nationwide variable that could lead to correlated error. I gave plenty of margin for candidate quality in specific races to surprise me, but I should have let this be correlated across states.
(1) and (2) together explain ~all of my error for the Senate. But I also got the House bias pretty wrong, and (2) can’t fully explain the House map - that’s where we get to (3). Look at this 2020 president → 2022 house swing map:
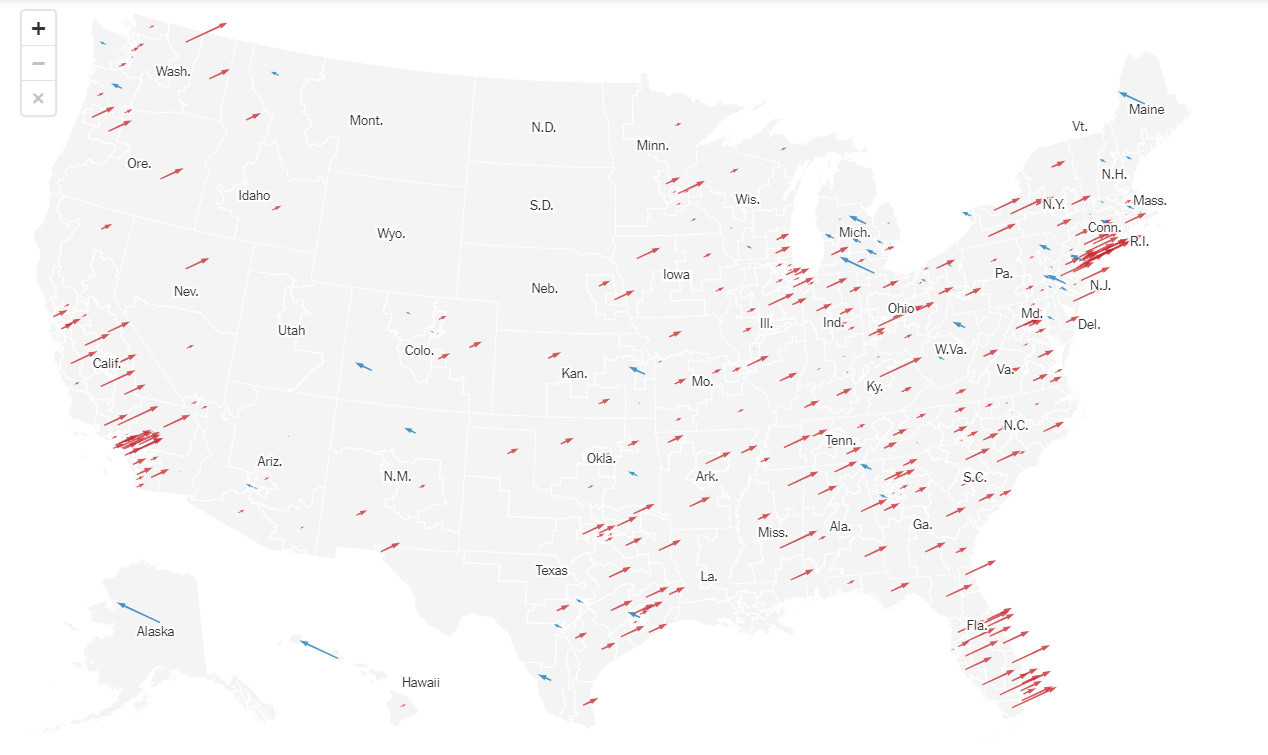
Democrats did terribly throughout the South, in Florida, in NY/NJ, and in some parts of California. They did ok in most of the Midwest and Northwest, and amazingly in the rest of the Southwest, Pennsylvania, Michigan and New England. These regional trends cannot just be results of House candidate quality. I would say there are three other hypotheses for these regional trends:
a) There were coattails from Democrats’ candidates in Senate/Governor races to the House
b) Democrats did better where abortion was more “on the ballot”, where there was more of a definite risk of abortion rights being taken away
c) There were some sort of demographic characteristics separating the places where Democrats did well from where they didn’t
I’ve heard the most talk about (b), but I’ll be honest I don’t really see it. It posits that that people in swing districts see their vote determining abortion access but people in red or blue states don’t. If they’re thinking about federal legislation that doesn’t make any sense, if they’re thinking of state legislation why would that impact their federal house vote? You also sort of have to cherrypick what you count as a swing state to make this argument. Overall I think it’s pretty weak.
I would guess that (c) is true to some extent, as most major trends have demographic explanations. I haven’t really seen much exploration of this yet, however. I would guess if anything religiosity would be explanatory, as that would correspond to Republicans doing well in the South and poorly in New England, and it would also make sense given the emphasis on abortion. But this could be totally wrong; I will wait off on making any claims until people start doing doing more precinct analyses. Overall, I will give demographic shift a solid Maybe.
I most buy (a). I’m actually pretty surprised to be saying this. The presidential election has coattails to downballot races, this is clear from glancing any election results and has been studied ad nauseum. Coattails from Senate/Governor races to House races, however, is a concept that I had never seen much evidence for before these midterms. I can’t find any studies on it from a quick search, either. Maybe Senate/Governor coattails make theoretical sense given the existence of Presidential coattails? But presidential coattails in my mind occur because of the quantity of media coverage of presidential elections, leading to a perception of their importance and thus their influence on everything else. Governor and Senate races don’t get nearly the same media coverage.
And yet… it’s kind of the only thing that explains these midterm results. Where Democrats did very well in statewide races - PA, MI, AZ , NH - they also did well in the House. The opposite applies to CA, NY and FL. It is of course hard to disentangle “statewide performance trickles down to the House” from “(Democrats/Republicans) did unusually well in these states for some other reason, this extended to both statewide and House results”, but I think we have reason to believe it’s the former. We know from results that candidate quality was very important, and most of these outperforming statewide candidates did better than the House races they could have had coattails on. Additionally, for many of these statewide races candidate quality is qualitatively clear and was anticipated even before seeing the results - the GOP Senate candidates had no prior elected experience, while Gretchen Whitmer and Ron DeSantis have gotten a lot of national media coverage. It thus seems reasonable that the statewide outperformances are attributable to candidate quality, and downballot races are coattails of this effect.
I don’t think there’s much I could have done to add coattails or any of these other effects given their lack of precedent and how complicated it would be to feed into a model. Correlated regional error, however, is reason to add more error to House/Senate bias (though I’m still not sure my House bias estimate was bad). In fact, I think the story of modern politics is one of consistently close national results mixed with really important underlying regional or demographic trends. That should have great bearing on election forecasts.
This is if we pretend there is no Georgia runoff and that the winner of the popular vote in the first round in Georgia.