
Gerrymandering is when politicians draw districts to benefit themselves. This is really only relevant in systems with single-member districts, which you should never adopt. Still, these systems do exist in practice, which means we do have to deal with the problem of gerrymandering. For the purposes of this piece, I’ll focus on the US House, with its single-member districts and two-party system. A lot of what I’m saying applies to other countries and US states as well, although there are different dynamics in these other places so they won’t be the focus. This post will be an exploration of what gerrymandering is, how to assess it, and how to prevent it.
Aims of Gerrymandering
The key to gerrymandering is to make the opposing side’s margins in the districts they win as large as possible while making your side’s margins as small as possible (while still being comfortable). Winning a seat narrowly is just as valuable as winning it by a landslide, so doing so allows you to win more seats. The general strategy to achieve this is “packing” most of the opposition voters into a few districts and “cracking” the rest of the opposition voters among many districts won by your side.
Seat-Vote Curve
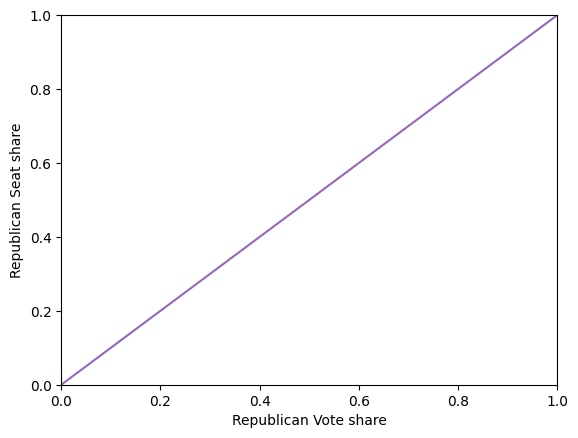
The best way to think about the political distribution of districts is to consider the seat-vote curve: what percent of seats a party can expect to win at different levels of vote share. A totally proportional system, for instance, is just a straight line with slope 1:
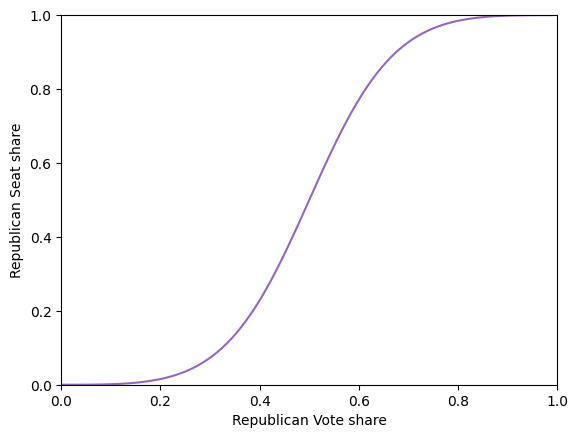
In practice, single-member districts always induce disproportionality, so the seat-vote curve will look more like this:
The goal of gerrymandering if you’re Republicans is to push the line upward, like this:
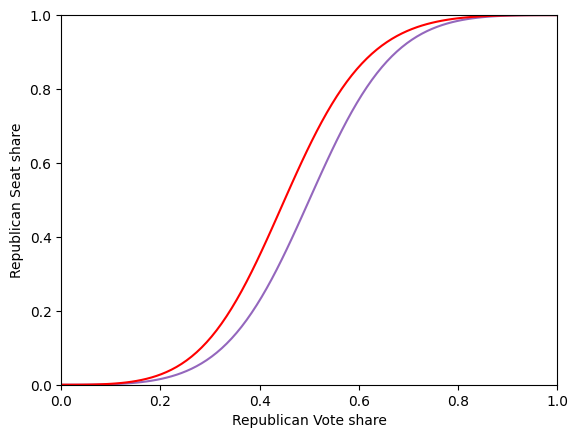
Generally, this reduces to two more specific goals:
Mean-Median Gap
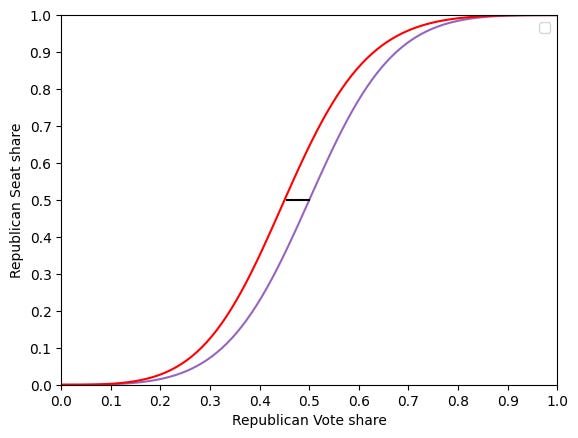
The chief goal of gerrymandering is to change the mean-median gap. This is the gap between what percent of the vote a party gets overall (which is almost the same as how well it does in the mean district, except for different districts having different turnout) and what percent of the vote it gets in the median district.
Since different districts tend to move in lockstep from election to election, the partisanship of the median district will generally determine which party wins a majority. That is, the mean-median gap will correspond to what I’ll call the “majority partisan bias”, the difference between 50% vote share and the vote share at which a party wins 50% of the seats:
The other thing to note is that candidate quality can mean the difference between winning and losing a race, particularly in a less polarized environment but also on the margins in a polarized environment like we have today. For this reason, the best way to measure the mean-median gap is at the presidential level, ie measuring the overall popular vote margin in the presidential election and then the margin in the median district (by presidential margin). Political margins on the congressional level have in recent elections closely correlated with presidential results, and because of the much higher media coverage that presidential elections get relative to congressional elections, we can be pretty sure that the presidential margin is causing the congressional margin far more than vice versa. 1
Of course, districts don’t move totally in lockstep. A more sophisticated analysis would consider not just the median district but all the close districts and how likely it is that, due to variance in candidate quality and in future seat trends, a party will win >50% of the seats at different vote shares. Like the seat-vote curve, the probability that a party wins a seat goes up much faster than the percent of the presidential vote they got in that seat:
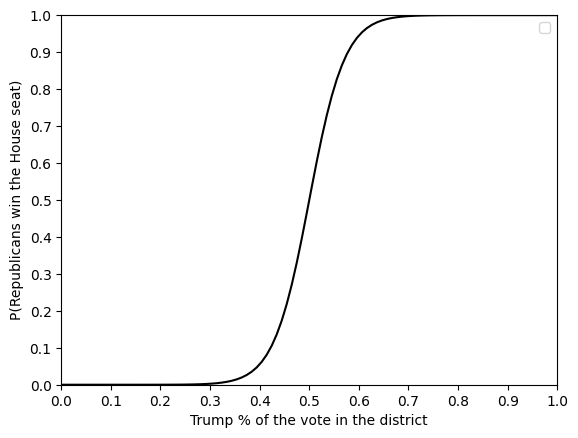
You might also object that the variance in future seat trends in different seats are not independent. If a Republican does better in one heavily Hispanic seat next election, they’re likely to do better in other Hispanic seats as well. If Democrats have gerrymandered many districts to be narrow victories off the backs of Hispanics, this might turn into a “dummymander”, where all of those seats flip at once.
All this said, in practice the mean-median gap is very predictive of the majority partisan bias, particularly if you consider not just the one median district but the few middle-most districts.
Proportionality
The secondary and strictly less important goal of gerrymandering is to win larger majorities, which corresponds to shifting the seat-vote curve upwards. The bigger your majority, the more defections your side can handle from moderate or otherwise rebellious legislators when passing legislation.
If every state elects legislators proportional to their partisanship, the overall results will be proportional. In practice though, this is very difficult: it’s usually impossible to draw a blue district in a 70+% Republican state, for instance, unless you have lopsided margins in a specific region. You’re going to have to expect disproportional results in lopsided states. The most you can hope for is that things will be proportional on the national level.
As illustrated by the above graphs, single-member districts in practice always lead to disproportionality; ie, a party that wins 52% of the vote will win more than 52% of the seats. In the 2024 Presidential Election, for example, Trump won 50.7% of the two-party vote and 52.9% of seats.
If you have totally proportional results, you’re guaranteed to have zero mean-median gap. If you have small mean-median gap however, proportionality may or may not be a good thing. Proportionality in that case basically means fewer competitive seats, which has interesting and potentially counterintuitive effects on politician ideology.
Credit to these Eharding posts for helping me think about this stuff more clearly.
Non-Political Objectives
What would it mean to draw lines without a political objectives? What other criteria of objective redistricting are there?
The main logic behind the different objectives that people point to is that districts should be homogenous. If a representative is elected by people with the exact same political views, that representative will be totally loyal to these views. (Once again, if you buy this logic, you should really just adopt proportional representation, which satisfies this logic precisely: a party will represent all people with views closest to them.)
With single-member districts, this logic becomes less obviously appealing. For starters, the way people think about this is pretty backward. A political group is often actually more powerful if it is split up between multiple districts than if it gets a district all to itself. Take a case where wealthy suburbanites are the swing voters and the rest of the state is split 50/50. These wealthy suburbanites will be most powerful if they are spread out among multiple districts, as they will determine which party gets elected in each of those districts, as opposed to if they are packed into a few districts and only determine which party those reps come from.
But ok, maybe you actually want homogeneity because you don’t want swing groups to be so powerful. Even then though, I don’t think this works as you might expect. The issue is that swing voters make up a relatively small percent of the swingy groups, and these swingy groups are not 50/50. Asian voters swung dramatically toward Trump between 2020 and 2024, but still probably voted for Harris pretty comfortably. Because of this, even if you put all the Asian voters into one district, it’s unlikely that district will be a swing district, because Asians still vote for Democrats overall. In practice, the real way you get swing districts is by putting a heterogenous group of people together, and then it will just be whichever swingy group happens to make up a decent percent of that district gets all the power.
Where I do think homogeneity maybe makes sense is at the primary level: you want to allow smaller interest groups to win primaries by clustering them together. This is what the VRA does did for minority groups, as I’ll get to in a second. (Again a proportional system would accomplish this better, but nevermind that.) This is a legitimate reason to want homogeneity, although homogeneity of primary electorate is different from homogeneity of general electorate.
Regardless of if you think the metrics I’m about to introduce have much objective merit, they are kind of “Schelling” metrics, compromises that people with different political objectives would naturally come to because what else are you going to optimize for. Optimizing for these metrics would cut down on gerrymandering just because you are not optimizing for political goals.
Compactness
There are a few different metrics of compactness, but generally what it means is that you want districts to look like this:
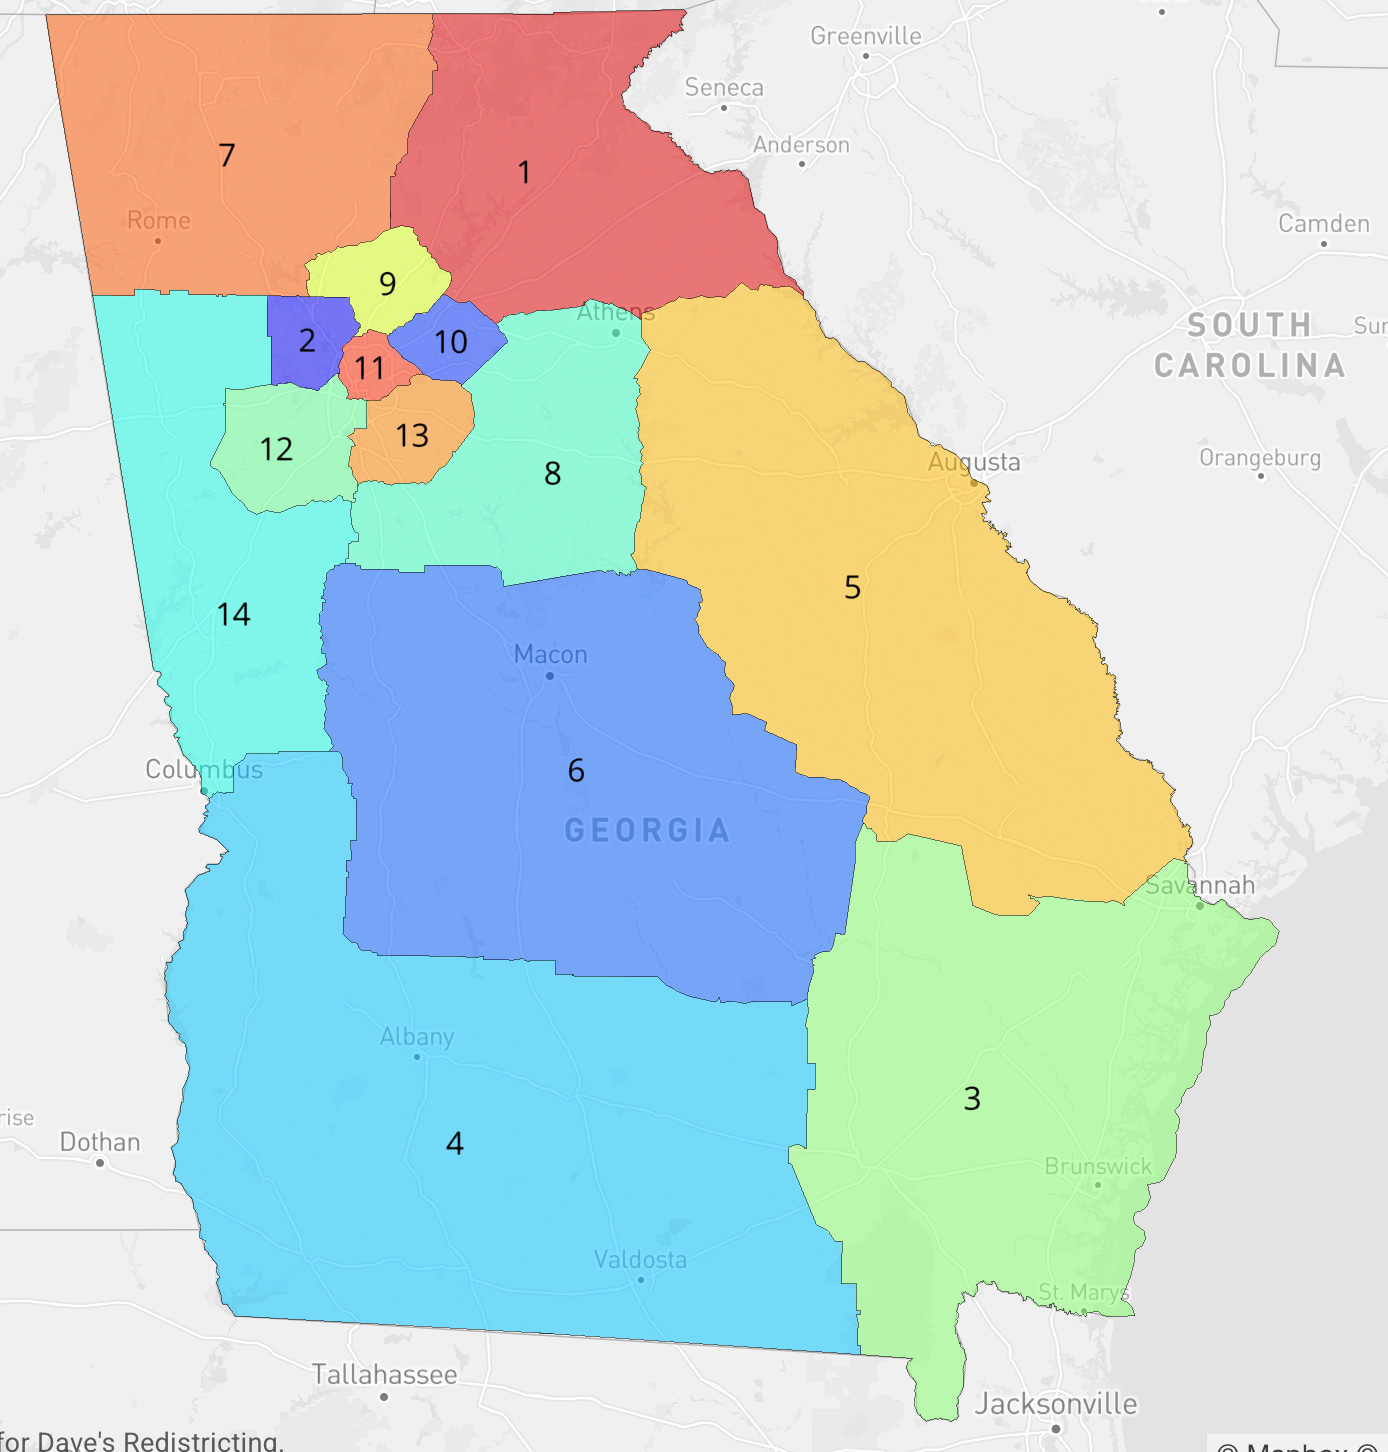
Rather than like this:
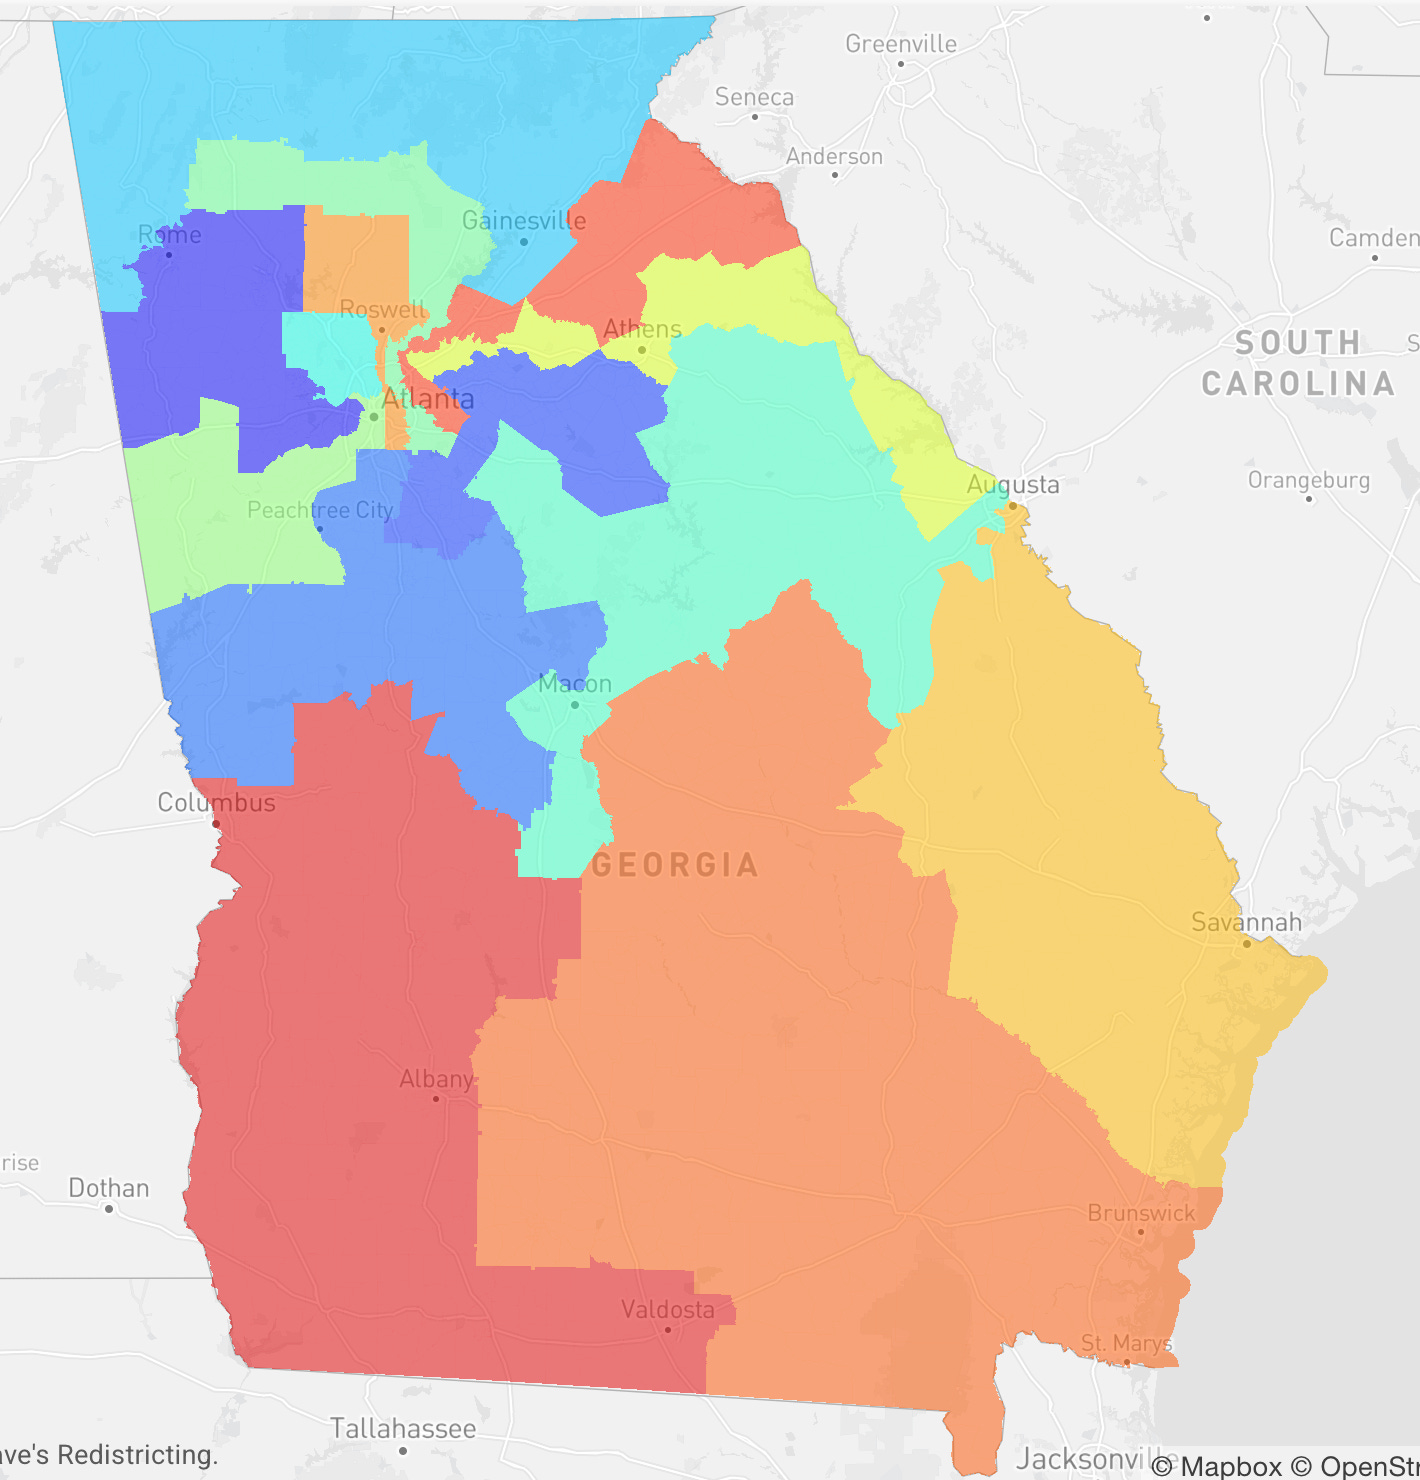
If you care about homogeneity, the right metric is probably the average distance between a voter and the center of population of the district, the center of population being the average x and y value of voters in the district. Smaller numbers are more compact. This basically measures how close to each other people live, with the assumption being that people closer to each other are more similar.
If you don’t care about homogeneity, you could measure it differently:
The average distance between a voter and the center of geography of the district, ie the average x and y value of land in the district
The diameter of the district, the max distance between any two points in the district.
The ratio of the perimeter of the district to its area
Splitting Locality Lines
This one is simple: how many counties, or cities, or precincts, do not sit entirely within one district (1 for every district the locality does not fit inside). Perhaps you could weight this by the population of those localities to account for gerrymandering being more effective when you split more populous localities. For homogeneity, the assumption is that people in the same locality tend to have more similar views.
Communities of Interest
You don’t just have to stop at localities: you can look at the geographic distribution of ethnic, racial, religious, etc. (for simplicity I’ll just say demographic) groups by precinct, and treat areas with lots of precincts each supermajority-demographic as quasi-localities whose lines should not be split.
I don’t love this metric because it gets pretty tricky and subjective:
First, you have to decide which demographics are of interest.
Next, you have to decide on what qualifies as a supermajority of a precinct for communities of interest purposes.
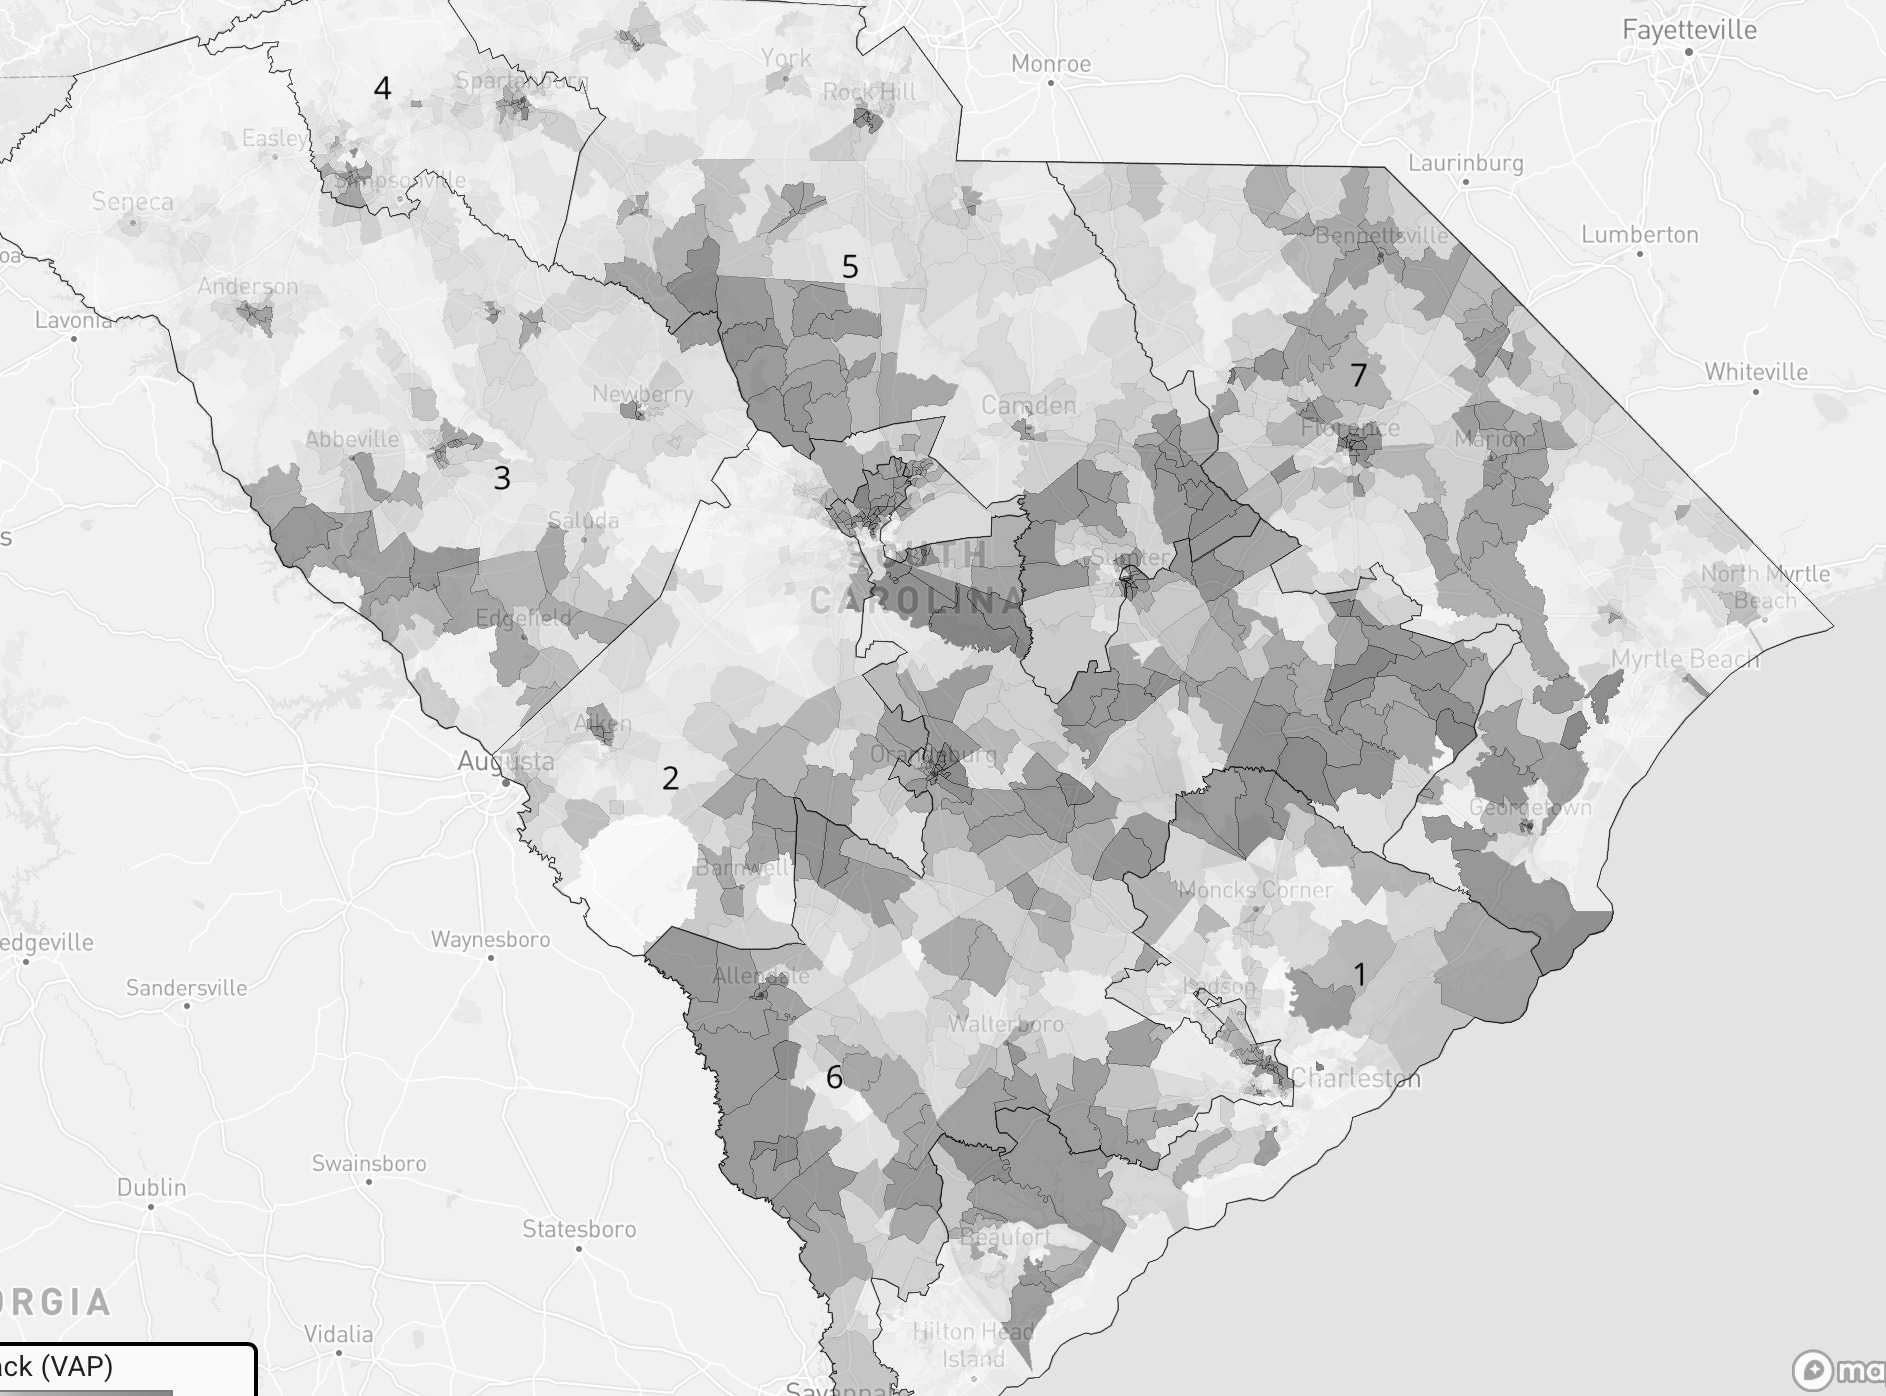
Next, you have to decide what to do with communities of interest when they are not totally contiguous, like there is a neighborhood separating two black regions that is not majority black. This is often relevant in the Black Belt in the south, which is pretty scattered. The darker areas in this map have higher black population:
Finally, the demographic distribution of a region often changes, so communities of interest can become outdated.
All this said, if you specify in law how to deal with the above issues, it might be ok. The Voting Rights Act in fact enforces enforced communities of interest for racial minorities.
Geographic Advantages
Gerrymandering means intentionally drawing lines to get a leg up. A party may however have an inherent advantage due to its geography. That is, lines drawn without political intent, perhaps drawn to optimize the above metrics, would still give one party an advantage.
Overall, Republicans have a geographic advantage. The general rule is that Republicans have a geographic advantage in the Deep South and Midwest/Rust Belt, while Democrats have a geographic advantage in the West Coast, New England, and Texas. There are exceptions of course: Georgia, New Hampshire, Maine are all pretty neutral, for example.
This great tool from FiveThirtyEight in 2018 (preserved via internet archive) is a good way to visualize this. This is their attempt at drawing districts matching objective criteria:
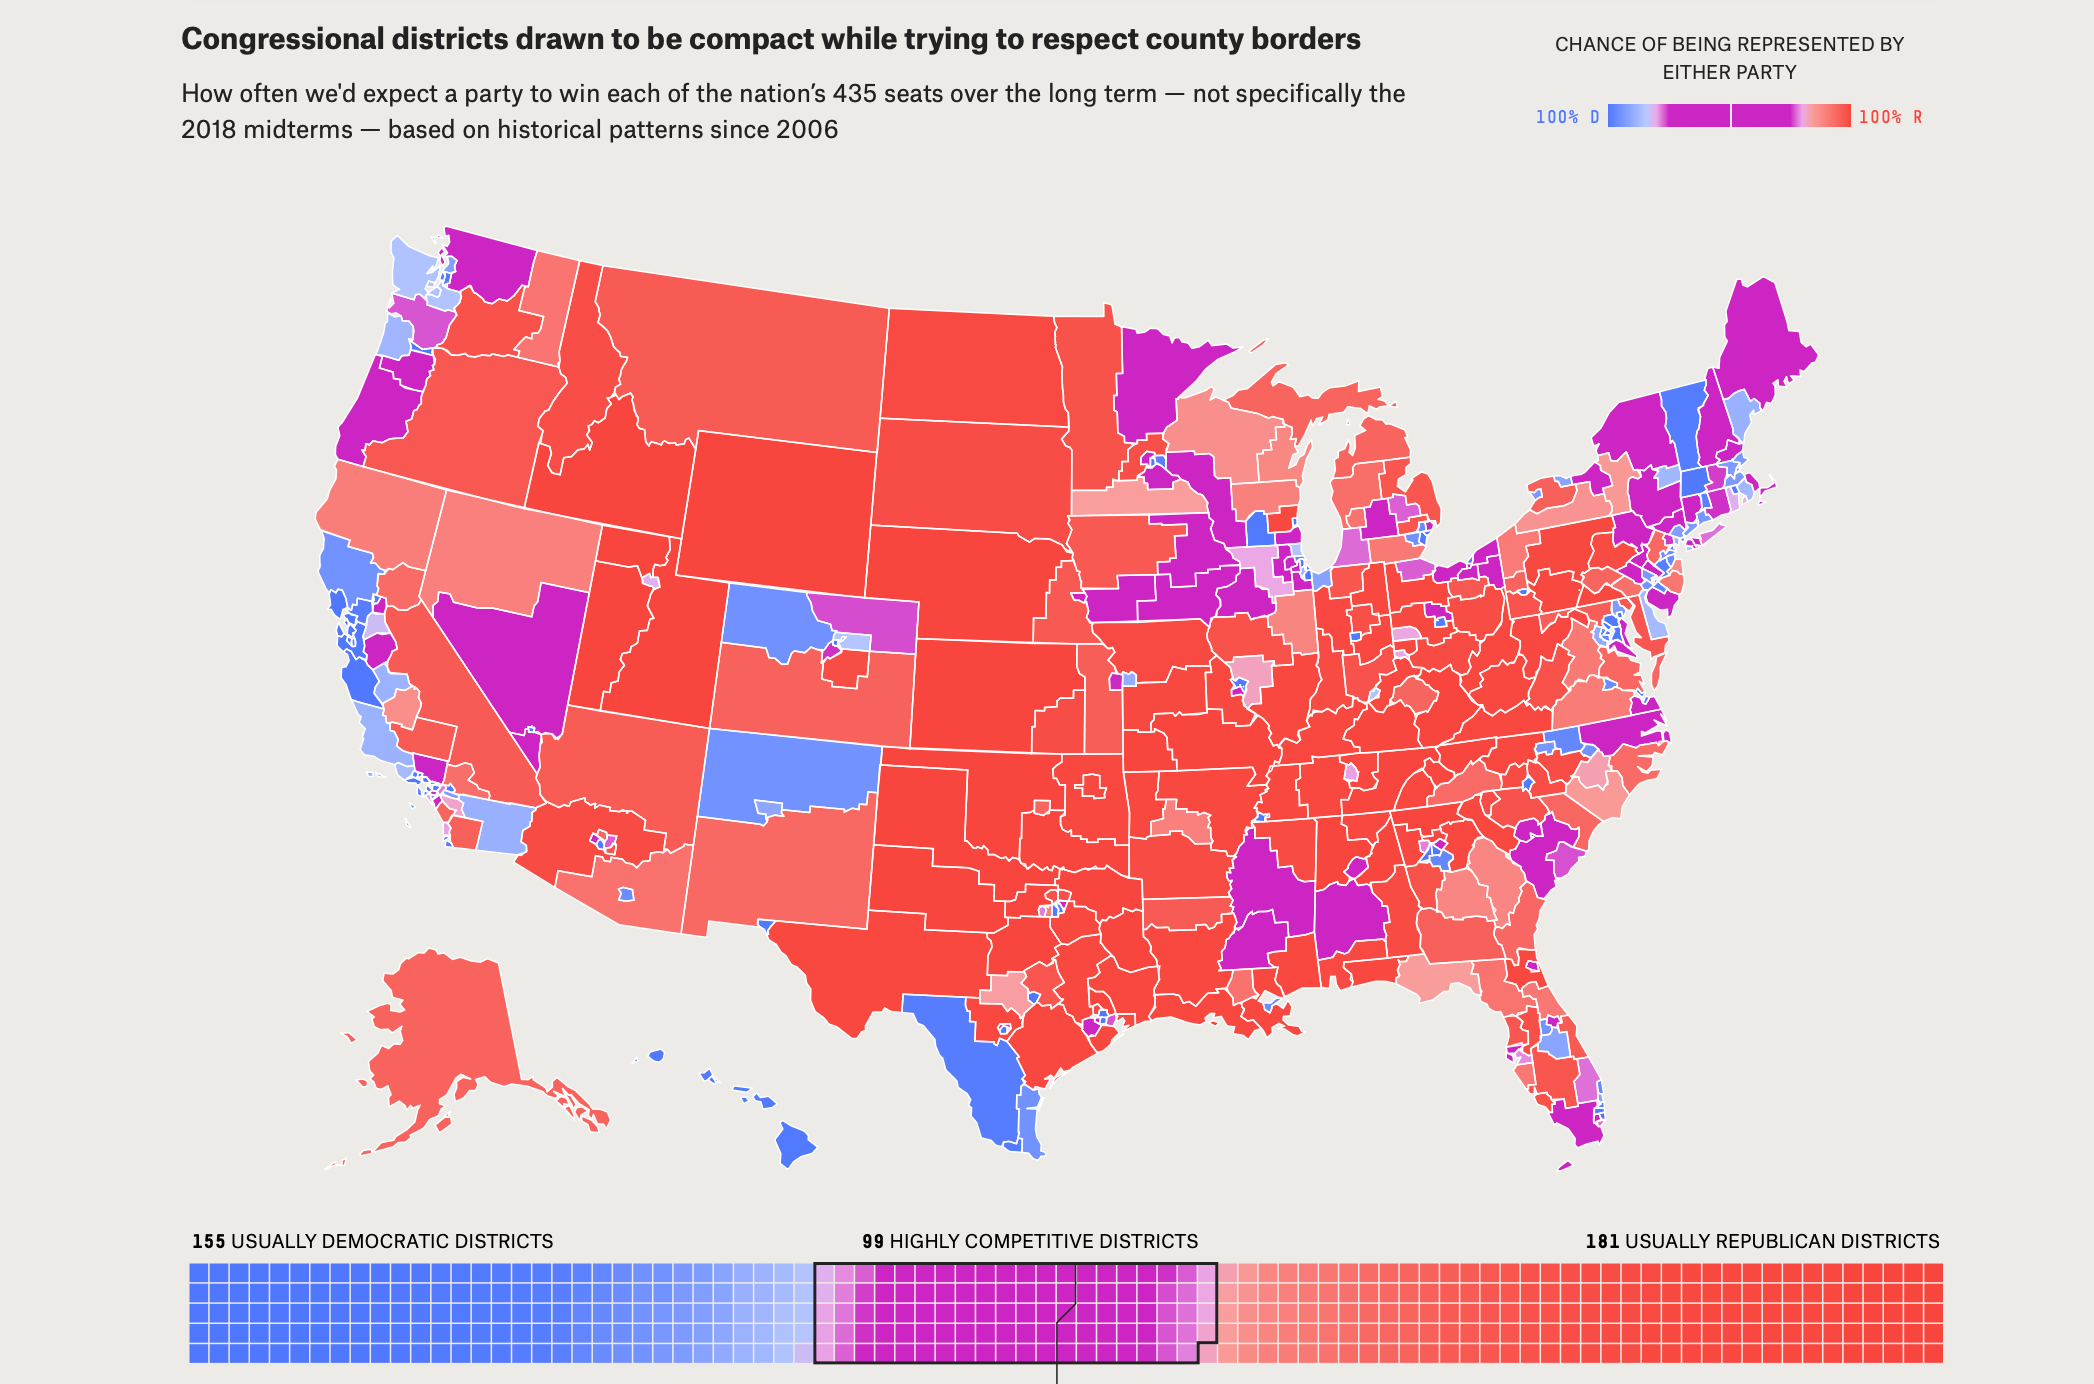
Some asterisks with this map:
This map does not comply with the Voting Rights Act, which helps Democrats overallThis map is outdated, Republicans have less of an advantage these days.
That said, it is possible to draw federal maps that score well on mean-median, proportionality, compactness, and splitting few county lines, you just have to try to do it.
Solutions
With all that out of the way, let’s get on to solutions.
The first thing you might think of is to have an independent commission drawing lines. This can be difficult. New Jersey and California have independent commissions but which ended up drawing democratic gerrymanders. They were quite mild gerrymanders by politician standards, to the tune of 2 (not super-safe) seats out of 12 in New Jersey and 5 out of 52 in California, but gerrymanders nonetheless. In both states, the commission had an equal number of Republican and Democratic appointees, but had tiebreaking procedures that involved people who leaned left2.
This isn’t always the case though - in Colorado, Arizona and Washington, the districts drawn by their independent commissions were genuinely fair. I think generally an independent commission results in less gerrymandering than politicians drawing it, but still not none. I also think it may not be possible to mandate the type of procedures that states have in place to make their independent commissions non-partisan. On the state level they mandate that members of the minority caucus in the legislature get to make appointees, which doesn’t feel like the type of thing you can mandate nationally (national election law is pretty party-blind), but maybe.
Is there a better metric-based alternative?
The thing that makes assessing partisan gerrymandering in the US tough is that you can’t use the mean-median gap. The mean-median gap only makes sense at the federal level, because of its correspondence with the majority partisan bias,and redistricting is done at the state level. You cannot possibly tell a state "redistrict in a way that minimizes federal mean-median bias". That sentence doesn't make sense, the state map that minimizes federal mean-median bias will depend on other states' maps.
(Maybe you could have a federal redistricting commission that approves states’ maps and is given a goal of minimizing federal mean-median bias? I’m skeptical of this idea though because it doesn’t seem like the commission can provide a meaningful reason to reject states’ maps if they don’t lead to small federal mean-median bias. I think the commission would have to tell a state something like “draw another Democratic district so that things federally are evened out”, which is not great.)
So instead you have to create other criteria to judge state maps on. Once you have some criteria to judge a map on, you still have to figure out how bad a map is relative to other maps. It might just be impossible to draw maps that are compact or that have high proportionality.
The approach taken by the plaintiffs in the Supreme Court case Rucho v. Common Cause was to generate a bunch of maps with an algorithm that optimizes for the objective criteria (compactness, splitting lines), and then assess how bad the adopted map relative to the other maps the algorithm spit out on partisan fairness. This is one solid approach if you can trust an algorithm enough.
Probably the partisan fairness metric you want to use is proportionality of presidential election results at various points close to 50-50. If you want to be extra mathematical about it, you can model elections with a normal distribution centered at 50-50, with the standard deviation measured historically3.
Another approach is to just use the algorithm. Have an algorithm defined in federal law that states are forced to adopt. This may or may not be constitutional - states are after all given the power to redistrict, federal law may regulate that but not override it. You also have to really trust the algorithm; if you trust the algorithm to optimize the objective criteria a good amount but not entirely, you might want to go with the above method.
Here’s an alternative idea I thought up. Allow a court to strike down a law if someone sues the state with a map that scores better on objective criteria and/or partisan fairness. Or instead of allowing people to sue with new maps after the fact, you can force states to take map submissions beforehand, and then courts can strike down a map if one of the maps submitted does better than the map chosen. (This is to prevent someone from coming along years later with some new map that forces redistricting.) Alternatively, you can simply force states to choose the submitted map that best satisfies the criteria, although this may not be constitutional as in that case it is the submitters rather than the state drawing the map.
If you choose this non-algorithmic approach, you need to either strongly select for objective criteria - strike down any map if there is another map that does even slightly better than it on objective criteria - or select for objective criteria + proportionality. If you only weakly select for objective criteria, this gives a lot of freedom to states to draw gerrymanders that happen to match objective criteria pretty well. That’s still better than nothing, but not great.
Another piece of evidence for this direction of causality is that the partisanship of congressional districts tends to lag presidential elections; for example, the best predictor of the House margin in 2026 is something like 2/3*(presidential margin in 2024) + 1/3*(presidential margin in 2020). Sources: FiveThirtyEight and some David Shor tweets that I can’t seem to dig up
In New Jersey the Democratic-appointed State Supreme Court leaned left; in California the non-partisan members of the commission leaned left